To simulate the effects of leakage resistance on low-speed stability, a suitable mathematical model is needed. The model must be consistent with actual hardware, and it evolved from test data collected from a motor at the Fluid Power Institute, Milwaukee. The motor was of balanced vane design with 10 in.3/rev displacement, pressure rating of 1500 psi, and speed rating of 1800 rpm.
The motor was subjected to a conventional 1-rpm test at a constant pressure of 1000 psi. Instantaneous torque and flow measurements were made and recorded on a strip chart recorder.
Outlet flow was measured with a positive-displacement motor of considerably smaller size than the test motor. The shaft speed of this small motor (essentially a fixed-displacement flow meter) was converted to a frequency, which was fed into a frequency-to-voltage converter to provide an analog signal proportional to the leakage flow. Case-drain flow was combined with motor outlet flow before entering the flow meter, thus total leakage flow was recorded.
Torque was measured with a strain-gauge transducer connected to a carrier demodulator system. Output was a signal proportional to instantaneous torque. Flow and torque were recorded simultaneously to allow assessing their relative phase relationships.
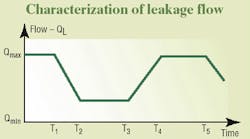
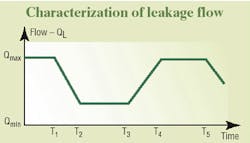
An input pressure of 1000 psi was established during the 1-rpm test. The resulting flow wave form made at the outlet of the motor closely resembled the trapezoidal wave form shown in Figure 1, with a variation in the minimum and maximum values of 1 gpm and 8 gpm, respectively. This produced a variation in the hydraulic resistance from 1.37 to 10.94 hydraulic ohms.
However, many more than the measured parameters were needed in the final model. Theory could help predict how the torque and pressure are related to displacement, and how flow and speed are related to displacement. There is a well-known, but simplistic model in common usage:
T= PD ÷ 2 p and Q = Dw
Where T is torque,
P is pressure,
D is the displacement,
Q is the flow and
w is the speed.
This model is too simple. It lacks dynamic effects due to inertial and fluid compressibility. More importantly, it lacks the variations in leakage and displacement as the motor shaft turns and the peculiarities of stick-slip friction. The model developed in this discussion attempts to include these factors. The result is a pair of differential equations that can be solved simultaneously with a relatively simple digital computer program.
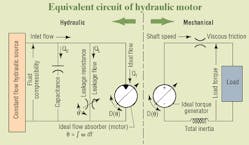
The equivalent circuit of the motor, Figure 2, is helpful in developing the motor's differential equations. Note that instantaneous displacement of the motor varies with rotational position, , of the shaft. For the inlet flow balance:
Qi= Qc+ QL+ QI (q)
For the outlet flow balance:
TI(q) = TV+ TL+ Jdw/dt
Substituting parameters from the test pump yields equations that can be mechanized into a state variable diagram to develop a digital computer simulation.
Modeling motor behavior
Data from the low-speed characteristics test were used to determine the leakage resistance. We assume that leakage flow is directly proportional to the motor inlet pressure. Thus, when leakage data are interpreted to be in the form of a trapezoidal wave form, Figure 1, and pressure during the tests is constant, the leakage resistance can be determined from results of a single pressure test. The break points for the wave form may be determined from the test data, from knowing the number of vanes in the motor, and the speed of the motor.
Results of the low-speed test showed that the torque generated at a constant inlet pressure varies as a function of the shaft's angular position. The program accepts input data from torque traces and assumes that all variations in torque are caused by variations in displacement. Frictional torque is considered to be constant and is included in the load. Therefore,
D(q) =2 p x TP(q) ÷ Ptest
where Tp(q) is the torque obtained during the low-speed test and Ptest is the pressure during the test.
Variations in the output torque resembled the trapezoidal wave form of Figure 1. However, the differences between the maximum and minimum values were on the order of 17%. The respective values of torque variation were 1200 and 1000 lb-in.
Modeling the motor and load friction
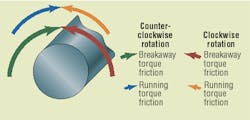
Motors and loads exhibit stick-slip friction characteristics, Figure 3. The significant property of stick-slip is that once stopped, a load requires a greater starting torque than is needed to keep it going. This property was simulated.
In specific terms of the simulation, the breakaway torque was taken as 1130 N-cm and running torque as 565 N-cm. Our tests were conducted for only one direction of rotation. Testing in the reverse direction would likely produce different values for breakaway and running torque, but breakaway torque would still exceed running torque.
|
Two-for-one electrohydraulic book deal The Designer's Handbook for Electrohydraulic Servo and Proportional Systems covers electrohydraulic system design, control, and analysis by teaching principles and reviewing practical problems from the real world instead of endlessly discussing complicated theories. Much of the information updates and expands on important concepts and calculations from such groundbreaking works as George Keller's Hydraulic System Analysis and Jean Thoma's Hydrostatic Power Transmission. The book sells for $99.95, plus shipping and handling. Covers everything from fundamental hydraulic circuit analysis to dynamic testing of motion control systems. Packed with more than 500 pages of useful formulas and dozens of fully worked examples. Twenty chapters cover hundreds of topics, including components, systems, circuit analysis, modeling, servomechanism and control, simulation, and testing. Special offer to H&P readers For more information, including a detailed table of contents describing all topics discussed, call IDAS Engineering Inc. toll-free at (877) 432-7364; (262) 642- 7021; e-mail idaseng@ hughes. net, or visit www.idaseng.com. The book is also available from Amazon.com, but must be ordered from IDAS Engineering to receive the bonus book. |
