This file type includes high resolution graphics and schematics when applicable.
Frequency response refers to graphing the dynamic response of output from a machine or process with a sine wave as the command input. Test equipment is available for testing a physical system, and analytical techniques and tools exist that allow using a completely theoretical approach. Here, we'll take a brief look at the frequency response method as a test procedure and summarize what the system designer can glean from the procedures and results.
The frequency response test method can be applied to anything, quite literally, if the device can be stimulated with a sinusoidal test signal and its output measured. Frequency response is most often encountered in electrohydraulic motion control in the data that manufacturers publish for servo and proportional valves. In fact, one compelling reason why I advocate servo and proportional valves for control - rather than other kinds of valves — is because so much frequency response data exists for servo and proportional valves, and almost none for other devices. Having this information puts us in a much better position to predict the performance of the system before we build it.
The frequency response test is quite simple and can easily be understood after a few minutes of observing the test. This is in contrast to months of study in a purely academic environment. It is one method for measuring the dynamic response of a component, such as a valve.
Another popular dynamic test procedure is to measure the output response to a step input. The frequency response and step response are related, because they come from the same system. However, the frequency response method is more reliable than the step response, because of the way in which distortion and noise are inherently rejected in the frequency response test when using a frequency response analyzer.
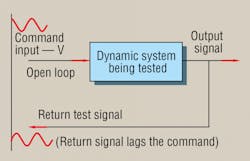
The test, represented in Figure 1, involves applying a controlled-amplitude sinusoidal wave shape to the input that causes the tested device, say — a valve — to cycle back and forth. Meanwhile, the output will cycle, too, at the same frequency. However, the amplitude of the output and command input will not necessarily be the same as the command input. In the case of the valve, input (current) and output (flow rate) aren't even in the same units of measure. Furthermore, output will, in most real physical dynamic processes, undergo a phase lag. That is, the output must necessarily lag behind the input. The test operator records the frequency, output amplitude, and the amount of phase lag between input and output (measured in degrees).
Next, frequency is increased while the input sine wave is maintained at a constant peak-to-peak amplitude. The phase is normally plotted in degrees and the amplitude is given in deciBels (dB) by this equation:
A = 20 log | On÷Ol |, where
A is the amplitude of the valve's frequency response
On is the output at any frequency, and
Ol is the output at the lowest frequency. Thus, we see that the frequency response test data for a servo valve always begins at 0 dB for the lowest frequency of a test.
With higher test frequencies, an attendant higher phase lag normally occurs, and the output amplitude changes. It is normal with any kind of machine that the output amplitude will be less able to keep up with the input amplitude with increasing frequency. That is, there will always be some frequency where the input command is vibrating so fast that the output cannot keep up at all. Therefore, the output amplitude tends to diminish with increased frequency, and the phase lag between input and output tends to increase.
There are exceptions. When resonances exist within the tested system, the output amplitude can increase with frequency over some narrow frequency band or range. Resonances occur when the potential energy stored in a spring or other flexible member is exchanged with the kinetic energy of a moving mass. Resonances occur in the hydraulic system when the kinetic energy of masses interacts with the potential energy stored in the internal compressed fluid.
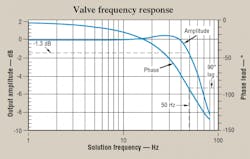
When resonances occur, they are sometimes revealed as rises in the output amplitude for increasing frequency. That is the case for the servo valve frequency response data shown in Figure 2. At 30 Hz there is about a 0.8-dB rise above the 0-dB reference level. The existence of the resonant rise indicates that there is a tendency for the valve to be slightly springy, and its output will tend to "ring" at approximately that frequency if tested with a step input. The rise indicates that the designers of the valve tuned its response to be under-damped. Most servovalves are tuned to have no resonant rise. However, there are some exceptions. The property of being under-damped is accompanied by a resonant rise. One way to describe this would be, "Under-damped means there are overshoots and resonant rises."
The frequency response graph in Figure 2, typical of many servo valves, at the very least can be used to compare the response of one valve to another. The important "benchmark" frequency for any valve is the frequency at which the phase lag reaches 90°. Note in the referenced valve that frequency is about 50 Hz. It should be obvious that if there is another valve with a 90° phase lag frequency higher than 50 Hz, that valve will respond faster than the one plotted in Figure 2.
The 90° phase lag frequency should always be used when comparing one valve to another. The frequency is called the valve frequency, valve frequency response, or the valve bandwidth. All terms are more or less synonymous. In any event, this frequency is useful in predicting how well the valve response matches the required performance of the application system into which it will be placed. Some designers use the 3-dB roll-off frequency; however, as a benchmark for comparison, it is unreliable. It also has no value in assessing how well the valve will perform with the rest of the componentry in the final system. The most important feature of the 90° phase lag frequency is that it allows us to compare the valve frequency to the hydromechanical resonant frequency, which is the resonance that occurs because of fluid compressibility (hydraulic capacitance, or compliance) interacting with the load mass at the actuator.
Some background
In Nyquist's seminal paper, he applied the idea of sinusoidal analysis to dynamic systems, but in very arcane mathematical terms, given the education of fellow engineers in his day. Nine years later, Bode presented his equally significant paper. He taught us that by expressing the amplitude of a sinusoidal frequency response in decibels, it becomes a simple matter of adding the amplitude and phase responses of one device (e.g. a valve) to the amplitude and phase responses of another device (e.g. the load and actuator subsystem) to obtain the composite phase and amplitude responses for a system. In those days - when the computational aid of choice was a slide rule - such a simple process was indeed welcome. In spite of the revolution in computers and the ease with which they perform complex calculations, the well-known Bode plot remains a favorite tool of system designers.
Bode and Nyquist (both were research engineers at Bell Laboratories) were intrigued by the idea of determining why some audio amplifiers would break into oscillation, while others would not. Today, designers of motion-control and feedback-control systems still struggle with the problems of oscillation in machines. If allowed to continue, this oscillation can be self-destructive. Frequency response methods allow us to make a reasonable estimate of the limits of electronic tuning that will produce a stable, oscillation-free servomechanism.
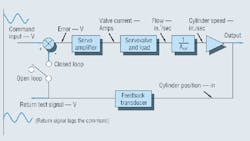
Bode's methods require that we test and study an open-loop system, then use analytical techniques to ask "what if" the loop is closed. For example, a complete positional servo mechanism, Figure 3, can be tested in its open-loop configuration to find the conditions necessary to make the system go unstable. Note that we do not use sinusoidal test data (frequency response characteristics) to determine how well the system will behave with sinusoidal inputs, but, rather, how much servo-loop gain we can get before the system oscillates. Such are the subtleties of frequency response methods.
To illustrate, consider the system of Figure 3. It will be first tested with the feedback switch in the open-loop position. As frequency increases, we look for any frequency that causes a 180° phase lag between command input and the open-loop feedback signal. (In hydromechanical systems, it is essentially certain that such a frequency exists.) At that frequency, if the output (open-loop feedback signal) has an amplitude equal to or greater than the input command amplitude, then the feedback switch can be closed. The 180° phase shift then undergoes another 180° of phase shift through the negative feedback process. The result is that the sinusoidal command input stimulus can be removed, and the closed-loop system will be in a state of sustained oscillation. This is an unstable system and is impractical if the oscillations cannot be stopped. Reducing servo-loop gain is the normal procedure to stop the oscillations. This is accomplished by changing the gain setting of the servo amplifier.
The foregoing paragraph presents the classical criterion for servo-loop stability in non-mathematical terms. It can be simplified a bit by changing the search for the 180° phase shift frequency. Consider this: Suppose in the search, the critical, 180° phase shift frequency is found, but the amplitude of the open-loop feedback signal is less than the command input amplitude. The open-loop gain at this frequency is less than one, which is less than zero on the decibel scale.
We now ask ourselves, "How can we increase the gain so that the feedback signal amplitude equals the command signal amplitude (zero dB of servo loop gain)?" We need only to increase the servo amplifier gain, and the system will break into oscillation. Therefore, anytime there is a 180° phase shift frequency, simply increasing the servo amplifier gain achieves sustained oscillation. A 180° phase-shift frequency exists in every electrohydraulic system, so we can always adjust such a system to the point of instability.
Of course, we do not want the system to oscillate. The purpose of tuning to the point of instability is to find the ultimate gain that will produce it. The gain is then reduced to about one-half the value that causes steady oscillations and is left there. This 50% reduction in gain is about the same as a 5-dB gain margin. That is, the gain is set 5-dB below the point of instability. This is sufficient for many electrohydraulic motion control systems. Using frequency response methods during the design process, we can predict what the gain will be for instability. Therefore, we can estimate the errors from instability to be expected in the servo system.
Resonant and valve frequencies
The hydromechanical resonant frequency (HMRF) is inversely related to the volume of fluid and the load mass: the greater the volume of fluid under compression, and the greater the load mass, the lower the HMRF. The lower the HMRF, the more difficult it is to achieve snappy, responsive control of the servo system. Instead, the system becomes slow and springy. Indeed, there are those who characterize the compressibility of fluid as equivalent to a spring. The analogy has some value.
This springiness can be a system bottleneck when the HMRF is too low. I have seen systems with an HMRF as low as 0.5 Hz, as high as 700 Hz, and all values in between. Low HMRF is a characteristic of large masses connected to small cylinders. Increasing cylinder area always has the effect of raising the HMRF. HMRF becomes the system bottleneck when it is less than the valve's frequency. The valve frequency, fv, is the frequency that produces a 90° phase lag according to frequency-response test data published by the valve's manufacturer.
Now we have a direct basis of comparing one frequency with another, which enables us to draw important conclusions. It is true that when it is less than the valve frequency, HMRF limits system response. However, the valve becomes the limiting device when its frequency is less than the HMRF. The rule is easy: The dynamic bottleneck is the lesser of fv and fn.
More often than not, a system is more difficult to design for crisp response when its HMRF is less than its valve frequency. Unfortunately, a system's HMRF usually is lower than its valve frequency. This means, therefore, that HMRF usually is dominant, which represents the most challenging design scenario. In other words, the worst-case scenario is the most common scenario.
Furthermore, when the valve frequency is about twice that of the HMRF, increasing the valve frequency produces negligible affect on system performance, because performance will be influenced almost totally by the HMRF. It should be clear that the closed-loop bandwidth must always be less than the lesser of fv and fn. The only question remaining: How much less?
Limitations to closed-loop bandwidth
The maximum closed-loop bandwidth (frequency response) must be less by an amount called the separation ratio, which always has a value less than one. In mathematical terms:
fmax < ps × (lesser of fv or fn), where
fmax is the maximum system closed bandwidth
ps is the separation ratio, and
fv and fn are the valve and hydromechanical resonant frequencies in Hz.
When HMRF dominates (< fv), the separation ratio is controlled entirely by the damping ratio of the hydromechanical system:
ps = 2Zn
where Zn is the damping ratio, a measure of the tendency for an oscillation to subside.
Two conditions contribute to damping — internal leakage from one side of the actuator to the other (whether from within the actuator or the control valve) and friction (whether from the actuator or its load). Because manufacturers strive to reduce internal leakage and friction, it should come as no surprise that the degree of damping in most hydromechanical systems can be very low. In fact, when the load can be moved with negligible friction (as when supported by a recirculating linear ball bearing), the damping ratio may be as low as 0.03 or 0.05. Admittedly, the system friction and the damping ratio are the most elusive quantities to evaluate in a system. Nonetheless, they, along with the frequencies, absolutely govern the performance limits of the system.
Sample calculations
Consider an example to demonstrate this discussion. Suppose that a system's hydromechanical resonant frequency has been calculated and found to be 18 Hz. Further suppose that its servovalve has a 90° phase lag frequency of 65 Hz, and we estimate the hydromechanical damping ratio, due to both friction and internal valve leakage, to be about 0.05. We can calculate the maximum possible closed-loop system bandwidth:
fmax < ps x (lesser of fv or fn)
fmax < 2 x 0.05 x 18
fmax < 1.8 Hz
The maximum closed-loop bandwidth, fmax, is only 1.8 Hz, which is only a tenth of the HMRF! At startup time, we increase the system bandwidth by increasing the servo amplifier gain. If we increase the gain until we have 1.8 Hz of bandwidth, and then attempt further increases, the servo loop will break into sustained oscillation, rendering it worthless. The gain must be decreased to re-establish stability.
System bandwidth is important because a direct inverse relationship exists between it and positioning accuracy, or, more correctly, the positioning error and the following error. It has been shown that:
∆xp = (∆IT × Gsp)/(2 ’ fsys).
Where ∆xp is the expected steady state positioning error (in.)
∆IT is the total expected valve current variation (amperes) caused by eight known external disturbances,
Gsp is the speed gain [(in.x A) / sec] at the highest expected speed and load, and
fsys is the actual closed-loop system bandwidth (Hz).
The output position is never where we want it to be — only close. There are eight known disturbances in the electrohydraulic positional servo mechanism that cause imperfect positioning:
• valve temperature changes
• supply pressure variations
• tank port pressure variations
• breakaway friction
• load variations
• valve hysteresis
• valve threshold, and
• valve dead zone.
All of these must be resolved into an equivalent valve current, then added together to yield the total expected valve current, delta IT. In general, evaluating these eight "error contributors" for a given system is more than a trivial process. Experience tells us, however, that for zero-lapped valves with "typical" servovalve performance, delta IT is about 2% or 3% of rated valve current. If the valve is proportional and has substantial overlap, then we usually use the overlap only and ignore the other seven contributors.
Technically, speed gain must be calculated - using the characteristics of the selected control valve - for the worst-case loading condition. If the designer uses good engineering practice for selecting the control valve (if the valve is selected to provide maximum power transfer at the worst-case load-and-speed combination), then speed gain Gsp will equal approximately the target design actuator speed divided by about 2/3 of valve rated current. Armed with this information, we can now estimate the expected system "accuracy."
Suppose the system we are designing must propel a load at 21 in./sec under worst-case conditions using a servovalve with essentially zero overlap. The numerator of the equation at the upper-left portion of this page can be evaluated first:
∆IT × Gsp = (0.02 × IR x 21) ÷ (0.67 × IR), where
IR is the rated valve current, which cancels out of the equation.
Now, ∆IT Gsp = (0.02 × 21) × 0.67
∆ITG sp = 0.63 in./sec.
If we assume that the servoloop has been tuned to the maximum allowed before instability occurs, then fsys is set to fmax, so the error can be estimated:
∆xp = ∆I T Gsp ÷ 2 ’ fsys.
But because the numerator has already been evaluated:
∆xp = 0.63 ÷ (2 ’ × 1.8),
∆xp = ±0.055 in.
We could expect, then, that the long-term positioning capability of this system would be about 0.055 in.
Jack L. Johnson is a contributing editor for Hydraulics & Pneumatics and president of IDAS Engineering, Milwaukee.
This file type includes high resolution graphics and schematics when applicable.


