By Jack L. Johnson, P. E.
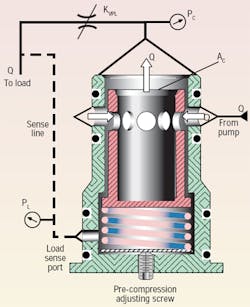
A pressure reducing, pressure compensated flow control valve is shown in a cartridge configuration in Figure 1. However, it is also manufactured in a conventional spool configuration. The operating principles are the same in both, it’s just the geometry and math models that differ somewhat. Figure 1 will also serve as a review, covering the function that was detailed in previous issues.
Anatomy of the valve
A moveable spool is shown in cutaway in red crosshatch, and a stationary cartridge body is shown in cutaway in green zigzag. This figure shows how flow metering and control are accomplished with circular metering windows of the spool and how they change their alignment with the fixed, circular metering windows of the body.
The spool has a brim at the bottom whose ridge prevents a bias spring from pushing the spool out the top, or nose, of the cartridge body. The brim also forms a barrier that hydraulically isolates the spring cavity (load sense port) from the compensator outlet at its nose.
The effective pressure sensing area of the spool is formed by the nose of the spool, and, thus, the spool senses the differential pressure drop across the metering orifice, KVPL. The spool, at once, senses its own outlet pressure, PC, at the cartridge outlet, and the load pressure, PL, via the load sense port connected to the bias spring cavity. The interaction of the differential pressure and the spring causes the compensator to try to maintain a constant differential pressure across the metering orifice. Therefore, it maintains constant flow to the load with a given 4-way setting, even in the face of changing pressures. We shall see shortly that this is only approximately true.
The spool fits closely inside the cartridge bore but must move freely without binding. Circumferentially machined balancing grooves (not shown in Figure 1) prevent the binding that will accompany radial pressure unbalance. Smooth, stiction-free movement also requires roundness, straightness, and smooth finish of the spool and bore because the radial clearance between them is normally only a few ten thousandths of an inch. The small clearance ensures control of spool bypass leakage. As with all spool valves, some leakage occurs. However, the leakage is not going to be modeled in this study because a slight amount of it does not significantly affect the performance of the valve. Other factors, we shall see, are far more important.
Figure 1 also shows how fluid enters the cartridge radially and exits the nose axially, making its way to the 4-way metering land, KVPL, then to the load. The cartridge configuration allows dedicating one compensator to each of the several 4-way sections in the valve stack. As explained in previous editions of “Motion Control,” this design method helps isolate the operation of one function from others to minimize interactive effects of loads during simultaneous operations. At least that’s the intent; we’ll examine the actual outcome shortly.
Setting up for testing
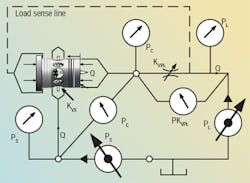
Figure 2 shows the basic circuit for the normal test procedure for measuring performance characteristics and for developing the system mathematical model. It shows both an adjustable load pressure, PL, and supply pressure, PS. KVPL represents the 4-way powered land, which is also adjustable.
A simplified test procedure calls for opening the 4-way powered land to some value and locking it there, setting the supply pressure at some value, and then adjusting the load pressure from near zero to near the supply pressure. However, this results in scores of observations and copious amounts of data. Instead, note that the controlling pressure, PS – PL, is the differential pressure across the entire circuit. This simplifies the test procedure and reduces the amount of data without any loss in performance measurements.
It is common practice to set the load pressure to zero and then simply increase the supply pressure to a convenient and safe maximum value, starting at or near 0 psig. The 4-way metering land is set to another value, again locked, and the supply pressure is again swept from a minimum to maximum. The result is a map of the complete pressure-flow (P-Q) characteristics.
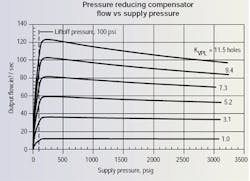
Figure 3 gives an example of the typical P-Q characteristics for a particular valve. It is important to realize that the data presented therein was created by a mathematical model of the steady-state conditions for that valve. It is not actual test data, however, the characteristics are very close to those expected of a real valve. The most significant reality is that the model can be changed, tweaked and/or adjusted to change and improve the characteristics in the same way that a real valve could be modified. The difference, though, is that it is must faster, simpler and cheaper to adjust the math model than it is to cut metal to make new prototypes. The things that can be done to the model to improve performance are the same things that can be done to improve performance of the real hardware.
Figure 3 shows what to expect from the valve with six different 4-way settings while the differential pressure across the circuit (PS – PL) is varied from zero to a bit more than 3000 psi. The most noticeable trait is that for low values of 4-way opening, (1.0 and 3.1 holes), the ability of the valve to keep flow constant is very good. However, for large values of 4-way opening, flow regulation suffers significantly.
Examining valve model characteristics
Before proceeding, we must define the pertinent input data that guided the calculated values in the steady-state simulation program results of Figure 3. The valve’s compensator spool diameter was set to 34 in. At valve design time, not all dimensional values are very well known or even knowable. For this reason, the program does not require the input of the circular window metering diameters. Instead, we enter the percentage of the circumference to be used for flow metering. In our case, it was 60%.
The next data item is number of radial holes around the circumference. With this additional value, we can calculate the actual window diameter. It then follows that 40% of the circumference offers physical strength to the spool. In our case, then, each window has a diameter of 0.235 in., giving the maximum effective spool travel of about 14 in.
The next input parameter, percentage of spool opening when flow angle reaches 70°, was set to 40%. This means the flow discharge angle reaches its maximum value when the spool has shifted 40% of the 0.235-in. window diameter. This calculates to 0.094 in., meaning that the windows are open, or overlapping, by about 0.141 in.
This strategy is used at design time because the amount of opening necessary for reaching the maximum discharge angle is a function of the spool-to-bore clearance in the specific valve. The amount of clearance is a function of the tolerance stackup in that particular valve specimen. At design time, that value is not known because a prototype does not yet exist. Furthermore, for small openings, the flow discharge angle is at its lowest, then increases as opening increases. In our case, the bias spring holds the spool and bore windows at their maximum opening, so the valve undergoes closure with increased pressure. This reality has been taken into account in the simulation equations. Therefore, the flow angle starts at its largest value and diminishes with increased pressure and window closure.
Proceeding with our establishing of input data, the spool liftoff pressure was set to 100 psig. The maximum simulated pressure — terminates calculation parameter was set to 3500 psig, which means the program will calculate and store values only if the calculated pressure is below this value. The next input data item is the spring coefficient. The program takes this value and the liftoff pressure to calculate the amount of spring precompression necessary for the simulated liftoff pressure.
We now have a feeling for the valve size and the parametric values, so, we’ll return to the simulation results of Figure 3. If we look at the curve where KVPL = 11.5 holes and follow it from zero to maximum test pressure, we can see what is happening inside the valve. Recall that the load pressure is set to zero in the simulated test procedure and the supply pressure is increased from zero to the maximum value. Also, the 4-way opening is held in some fixed position, and we record the output flow along with other performance variables. The result is shown in Figure 3.
At low pressure, the bias spring holds the compensator spool in its full open position. Therefore, flow increases rapidly, following characteristics of flow through a fixed orifice. When the pressure reaches 100 psig, the bias spring force is overcome and the compensator spool begins to begins to close. But, the closure is not immediate, so the flow does not reduce, even though the compensator spool opening is decreasing. In fact, the flow continues to increase after liftoff, and reaches a maximum flow of about 125 in.3/sec at 220 psig — almost double the lift-off pressure. This response is very typical of this type of flow compensator.
Before delving further into this discussion, it would be helpful to review the equation for flow force, which is where next month’s edition will begin.
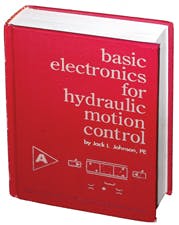
Basic Electronics for Hydraulic Motion Control
This is where your basic electronic training starts. This book, unlike many others, is written specifically by a practitioner of the hydraulic art for engineers and technicians working in hydraulics, but it teaches you all you ever needed to know about electronics. Your personal understanding of hydraulics is your ticket to learning electronics with this book, which is filled with analogies to simplify the understanding of concepts.
Everything you wondered about and need is here: transducers, interfaces, signal conditioners, pulse width modulation, controllers, amplifiers, transistors, analog electronics, digital electronics, and much, much more. It is a must read and reference for anyone interested in certification in the exploding technology of electrohydraulics.
It uses your knowledge of fluid power to help you learn and understand electronics. Order your copy now and get the book that makes electronics fun and easy to learn.
Authored by Jack L. Johnson, P.E., edited by Hydraulics & Pneumatics, and published by Penton Media, the hard cover textbook (ISBN 0-932905-07-2) contains 438 pages and sells for $99.00, plus shipping and sales tax. To order, or for more information, visit the Bookstore.
