What is reliability? Of course, technical definitions exist, but what is reliability in practical terms? We can all identify with some common examples:
• your car starts right away on a cold morning
• your flight departs and arrives on time
• your restaurant order meets or exceeds all your expectations, and
• all the parts of your child’s ready-to-assemble toy are in the box — including sensible instructions.
Okay, maybe some of these aren’t so common, but if reliability is a number from zero to one — a percentage — how would you grade these experiences? How would you grade some of the products you purchase? Now, how do you think your customers grade your own products’ reliability?
That last question might be a little more difficult, and we may be a bit more defensive about it. If we wanted to be fair, some guidelines could be established to make a uniform judgement — industry standards to determine the reliability of fluid power products.
NFPA began the formidable task of developing such standards and recommended practices back in 2001, and some of them are now available. The basis of these standards varies from measuring data in a laboratory to collecting data from field use. If the product is a hydraulic component in a directional boring machine, it encompasses theories of reliability analysis, which include heavy doses of statistics. Therefore, this article presents a simple, non-mathematical explanation of the statistics on which the published and ongoing NFPA standards and recommended practices are based.
As stated in the new standard and recommended practice, “Reliability is associated with dependability and availability, successful operation and performance, and the absence of breakdowns or failures. Failure occurs because of manufacturing defects, misapplication of product, inadequate maintenance, cumulative wear and degradation, design deficiencies, and random chance.” This means that although some of the responsibility for a component’s reliability lies with the component manufacturer, much of it lies with the designer of the machine in which the component is used and the end user.
Reliability and failure statistics
The reliability statements about products are obtained from samples — either observed in an application or measured in a laboratory. So when a reliability statement is made, it is a prediction of the performance of similar products based on those samples. But predictions are not always accurate; consider a weather report. These reports suggest a probability of rain — not a specific statement that it will or will not rain tomorrow. Likewise, reliability of a fluid power product is a probability that it will perform a specific function, in a specific environment, for a specific duration. That’s a lot of specifics!
Now consider the variety of conditions into which fluid power products are used, and it becomes obvious that some clarifications are necessary. A Buna-N seal may last a long time at room temperature, but it could fail in a few minutes at high temperatures. But what is failure? Because test conditions are necessary, test standards have definitions for the operating environments. Statistical measures require a comparison of failures to successes. If no failures occur, no statistics are available — unless you believe in 100% reliability. Two classifications of failure exist: a sudden cessation of function, and a gradual deterioration of performance. The first one is easy to observe, but the second one is subject to interpretation.
The experts developing the NFPA documents tackled this question and came up with specific values for leakage, friction, time delay, etc. It was not easy, and it was only decided after the concept of failure was modified to be a threshold value.
Imagine several competitors gathered to define failure of their products. That could have killed the project even before it was started. But these participants agreed on a level of performance that, when reached, would terminate a test unit in a laboratory program for statistical analysis. The product would still be functional, but would be considered to have reached a performance level sufficient for termination. Thus, statistical failure is a conservative concept for determining the reliability of products.
The Weibull method
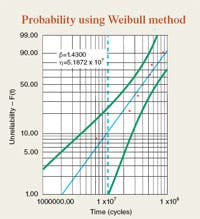
A language is necessary for discussing reliability. The NFPA standards use a Weibull analysis graph to plot results and describe conclusions. The Weibull method is commonly used for analyzing data from reliability testing because of its versatility in modeling various statiscial distributions. However, the complexity of the equations means they are most readily solved using software. An example is shown in the graph.
In the graph, failure data (test specimens that have reached a threshold) are shown as green dots in the plot. The horizontal axis is the time (in this case, cycles) to reach termination, and the vertical axis is a probability number, which is obtained from a table. It represents the fraction of the population (not just the test unit) that has failed on a cumulative basis.
The most immediate observation is that failures do not occur all at the same time. Thus, the first dot, at 7,260,000 cycles, represents that about 8.4% of the population would have failed by this point. This is based on the sample of eight specimens (one specimen was suspended during the test and does not appear on the plot).
Therefore, some term must be used to explain that products will reach the end of their life progressively. The term most commonly used is the life at which 10% of the population has reached failure — the B10 life.
Examining test elements
The straight blue line in the graph is a best fit representation of the data. But will these same data occur again if the test is repeated with another sample of eight specimens? How about several repeated tests? The answer, of course, is almost certainly not.
Additional test results will yield more blue lines that will lie between the green curved lines. These green lines — called confidence bounds — form the limits for subsequent test data. Typically they are calculated for a 95% lower limit (on the left), and a 5% upper limit (on the right). So if the test is repeated many times, the data will lie within these bounds 90% of the time. Only 5% will fall outside either confidence bound.
The Weibull graph also shows two B10 life values. The first occurs at the intersection of the blue line with the 10% cumulative failure, at a life of 10.1 million cycles. However, this results from just one test. There will be several blue lines to examine when the test is repeated many times, and the ones of interest will be at the lower values of life. Therefore, choosing the green curved line at the left would yield a 95% confidence that the B10 life would be at least 4.1 million cycles.That leaves 90% of the population still operating satisfactorily. Therefore, another parameter, characteristic life, is also used. This point is at the 63.2% level because it results in a fixed value regardless of the slope of the blue line for a given set of test data.
In there-peated test concept, the slope of the blue (best fit) line can also vary — which is why the confidence bounds (green lines) containing them are curved. Each set of such test data has a best fit line that is a compromise of its slope and its distance from each data point. But regardless of the compromise, all possible curves for one test will cross through the 63.2% level at the same value of life. It is a characteristic of the mathematics of a Weibull distribution, which is why it is called the characteristic life. Characteristic life is usually associated with the blue line from the test data, and in this example it is 51.8 million cycles.
The last consideration is the slope of the blue line, which is 1.43 for this example. Values between 1.0 and 2.0 (sometimes to 3.0) are typical for fluid power components. A lower number indicates that the resulting spread of life from a test is smaller; higher values indicate a greater spread. A value of 3.6 often corresponds to a normal distribution, and values higher than 10 should be suspect of poor test results.
For more information, contact the author at [email protected]. This article is based on a paper presented by the author and contains extensive references to additional information. the document can be viewed or downloaded from the June 2009 issue archived on our website, at www.hydraulicspneumatics.com.


